
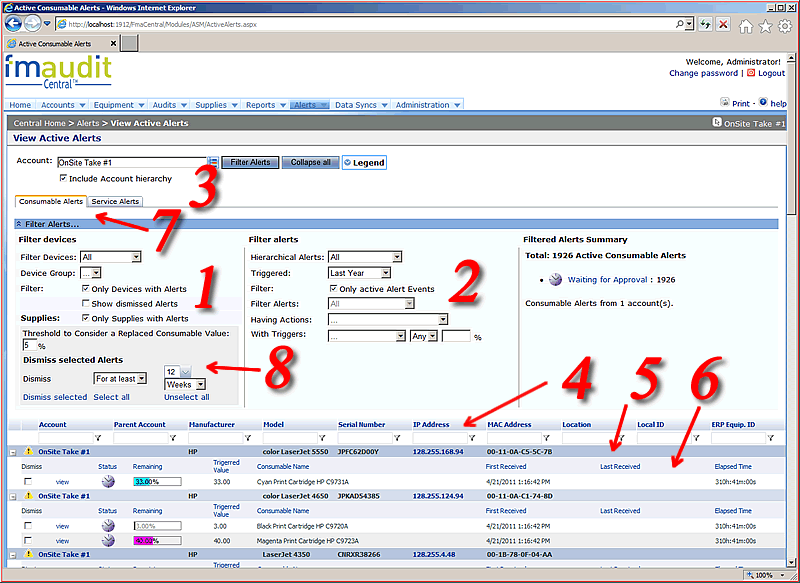
Figure 1: Consumable Alerts tab active.
Filter devices: Section (1) Allows you to select values for filtering the devices. The options include:
Filter alerts: Section (2) Allows you to select values for filtering the active events. The options include:
Notes:
![]() Please note that this section looks different for Service Alerts tab (see figure bellow).
Please note that this section looks different for Service Alerts tab (see figure bellow).
Account selector: Section (3): The combobox allows the user to select the account contianing the devices and a check box for filtering the child accounts or not.
Table filters:s: Section (4): After typing
a value, click on the ![]() icon to display
a popup menu with the applicable filters according to the data types for their respective
columns.
icon to display
a popup menu with the applicable filters according to the data types for their respective
columns.
Device headings: Section (5) This lines contains information about devices:
Device events: Section (6) By expanding one (or all) of the rows shown in lines 5, the user can inspect the events that have occurred for each device (according to the filter in Section 3). The user can see:
Alert type tabs: Section (7) This tab allows the user to switch between Consumable Alerts and Service Alerts (see figure bellow).
Dismiss alerts: Section (8) This area contains controls for dismissing selected alerts.
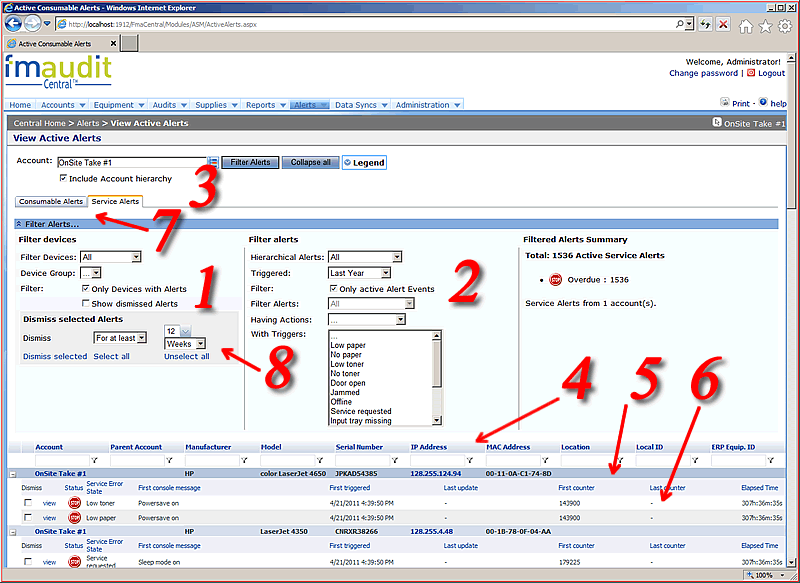
Figure 2: Service Alerts tab active.
Please note that Service Alerts tab looks similar with Consumable Alerts except that dismissing alerts doesn't contain a field for specifying the threshold for consumable level above which the consumable is considered replaced and for filtering alerts (section 2) the filter allows the user to specify the events that triggers the alerts (Low Paper, No paper etc.).
Notes:
![]() Displaying the information in this page can take several minutes, depending on the amount of data
requested. To reduce loading times, consider narrowing the filter criteria for both devices and events.
Displaying the information in this page can take several minutes, depending on the amount of data
requested. To reduce loading times, consider narrowing the filter criteria for both devices and events.
|
Copyright © 2008 FMAudit, LLC. All Rights Reserved. |